In the ever-evolving landscape of financial technology (fintech), the role of data visualization for fintech cannot be overstated. Fintech companies thrive on data-driven decision-making, leveraging insights to optimize processes and deliver exceptional user experiences. However, the sheer volume and complexity of financial data can often pose a challenge, making it difficult for stakeholders to extract actionable insights efficiently. This is where data visualization emerges as a game-changer, revolutionizing the way fintech companies interact with and derive value from their data.
Data visualization and fintech:
Data visualization refers to the graphical representation of data to facilitate understanding and analysis. In the context of fintech dashboards, data visualization plays a pivotal role in transforming raw data into meaningful insights such as charts,graphs and infographics empowering stakeholders to make informed decisions and drive business growth. Data visualization in fintech serves several purposes:
- Insight Generation: By presenting complex financial data in a visual format, data visualization enables users to gain insights into their financial performance, trends, and patterns. For example, visualizing spending habits over time can help individuals identify areas for budget optimization or investment opportunities.
- Risk Management: Fintech companies use data visualization to assess and mitigate risks associated with financial transactions, investments, and lending. Visualizing risk factors and trends allows stakeholders to make informed decisions and implement risk management strategies effectively.
- Performance Tracking: Data visualization helps track the performance of financial products, portfolios, and investments. Real-time dashboards and interactive charts enable users to monitor key performance indicators such as return on investment , portfolio diversification, and asset allocation.
- Customer Engagement: Fintech companies leverage data visualization to enhance customer engagement and satisfaction. Intuitive and visually appealing interfaces make it easier for users to understand their financial data, leading to increased user retention and loyalty.
- Predictive Analytics: Fintech firms use data visualization techniques to perform predictive analytics and forecast future financial trends, market conditions, and customer behaviors. Visualizing predictive models and scenarios helps stakeholders anticipate risks and opportunities and make proactive decisions.
Now that we’ve explored the purpose of data visualization in fintech dashboards, let’s delve into how it revolutionizes the interpretation and utilization of financial data.
Simplifying Complexity:
Financial data is inherently complex, often comprising multiple variables, metrics, and trends. Data visualization simplifies this complexity by presenting information in a visually intuitive format. Through charts, graphs, and interactive visuals, fintech dashboards enable stakeholders to grasp complex data relationships, trends, and patterns at a glance. This simplification accelerates decision-making processes and enhances overall data comprehension.
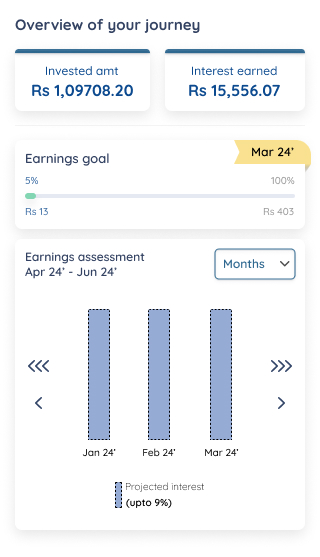
For instance, an investment app’s dashboard can effectively present investment details using various intuitive visual formats such as line graphs, bar charts, and pie charts. Principal outstanding and principal returns could be best represented using a bar charts graph, providing clear comparison between 2 metrics. Interest earned and interest projected could be displayed using a line graph,showing the trend of these amounts over time.
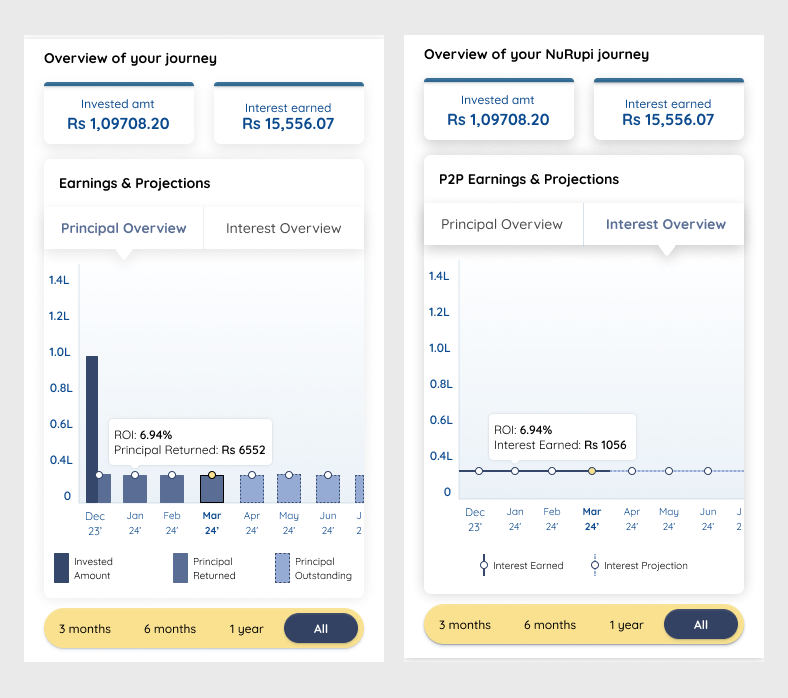
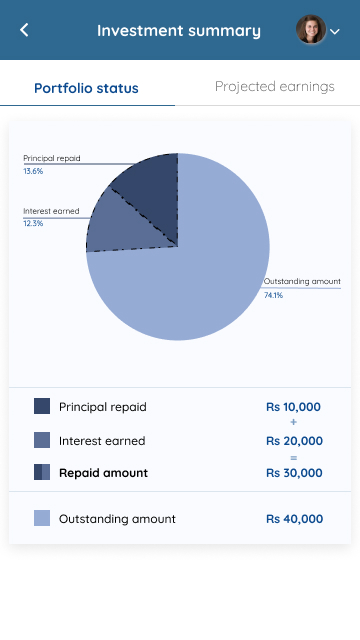
Additionally, the invested amount could be depicted using a pie chart, showcasing the distribution of investments across different asset classes or categories. These visualizations offer investors a comprehensive overview of their investment portfolio, aiding in better decision-making and portfolio management.
Enhancing Decision-Making in Fintech:
In the fast-paced world of fintech, timely and informed decision-making is paramount. Data visualization empowers stakeholders with the insights they need to make strategic decisions confidently. Whether it’s assessing market trends, monitoring portfolio performance, or identifying emerging risks, fintech dashboards equipped with powerful visualizations provide stakeholders with the clarity and context necessary to drive action.
Let’s look at this with an example… Data visualization empowers investors to extract meaningful insights from their investment data, enabling them to make informed decisions with ease. By visualizing key metrics such as principal outstanding and interest earned over time, investors can identify trends, track performance, and assess the overall health of their investment portfolio.
Projections of future interest earnings provide valuable foresight, allowing investors to plan and strategize their investment decisions effectively. Armed with actionable insights, investors can optimize their investment strategies. This helps mitigate risks, and maximize returns in the competitive landscape of investment.
Facilitating real time monitoring & analysis:
Real-time insights are invaluable in today’s digital economy, where agility and responsiveness are essential for staying competitive. Data visualization allows fintech companies to monitor key metrics and performance indicators in real-time. This provides a pulse on market dynamics, customer behaviors, and operational performance. By visualizing data in real-time dashboards, stakeholders can quickly identify, address, and capitalize on fleeting opportunities. Thus driving agility and innovation across the organization becomes easier.
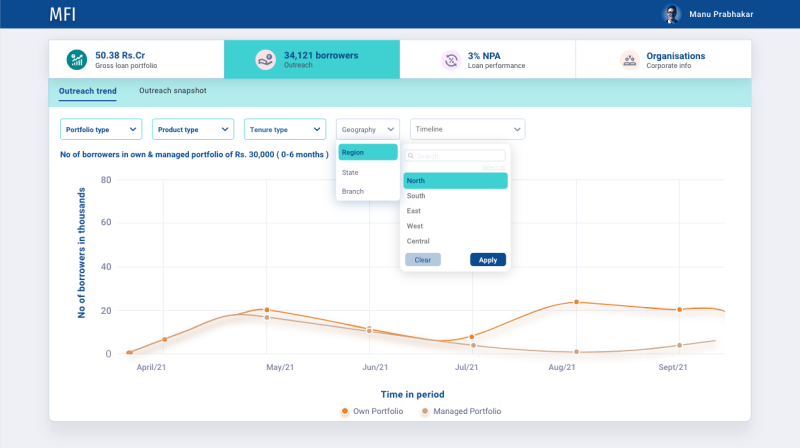
Data visualization plays a crucial role in aiding loans providing companies’ business teams in analyzing their company’s growth across different categories. For instance, a dashboard could visually represent how well a company’s product is performing in various geographical areas. Through interactive charts, business teams can quickly identify regions of high demand or areas where the product is underperforming. This allows companies to allocate resources strategically, tailor marketing efforts, and optimize their business operations for maximum efficiency and profitability. By leveraging data visualization tools effectively, loan providing companies can gain valuable insights into their business performance and drive informed decision-making to fuel growth and success.
Conclusion
Data visualization plays a pivotal role in the fintech landscape, offering a multitude of styles to effectively communicate insights and trends.
- Bar Charts and Column Charts: Compare categorical data or show distribution across categories. They are easy to interpret and suitable for presenting discrete data.
- Line Charts: Ideal for showing trends over time or continuous data, such as stock prices or temperature fluctuations. They highlight patterns and changes over a continuous scale.
- Pie Charts: Illustrate parts of a whole, where each category represents a proportion of the total. They are effective for displaying simple data distributions but can become cluttered with too many categories.
- Scatter Plots: Display the relationship between two variables by placing data points on a Cartesian plane. They are useful for identifying correlations or clusters within the data.
- Heatmaps: Visualize data in matrix format using color gradients to represent values. They are effective for displaying large datasets and identifying patterns, especially in geographical or spatial data.
- Histograms: Show the distribution of a single numerical variable by dividing it into intervals (bins) and plotting the frequency of data points within each interval. They provide insights into the data’s central tendency, variability, and skewness.
- Tree Maps: Represent hierarchical data using nested rectangles, where each rectangle’s size and color represent different attributes. They are effective for visualizing hierarchical structures and comparing proportions within categories.
- Bubble Charts: Compare three variables using bubble sizes in addition to x and y-axis. They are useful for displaying relationships and trends among multiple variables simultaneously.
Overall, these diverse visualization styles cater to various data types, audience preferences, and communication objectives within the fintech sector. This helps in enhancing understanding and decision-making processes across the board. Hope you enjoyed this read, here is an additional piece you can read for upgrading onboarding processes in a fintech app.
Reach out to us for any design related queries at info@ionixxtech.com.