In financial markets, market data or data analytics are crucial in determining the intricacies of trade outcomes. With more reliable and current market data, traders and investment advisors can interpret the market steadily without any confusion. It gives them confidence to make informed decisions about buying, selling, and holding a particular stock or securities. In this blog, we discuss how and why market data is crucial in determining trading patterns.
How Does Market Data Work in The Capital Markets?
The process of analyzing large datasets to uncover patterns, insights, and trends is referred to as data analytics using market data. While data analytics tools find application across various sectors such as healthcare, politics, retail, banking, and government organizations, they hold a crucial role in maintaining competitiveness within modern financial markets.
Similar to other industry domains, professionals in the security market have increasingly relied on both current and emerging technologies to effectively perform the trade with more insights. Big data is extensively utilized in the financial sector to mitigate previously unidentified risks. AI has been employed to forecast stock performance based on quarterly earnings calls. In financial data analytics, machine learning, particularly neural networks, has superseded the use of rigid algorithms.
One prominent example is Natural Language Processing (NLP), which leverages neural networks to comprehend human speech. NLP software can listen to conference calls, interpret business reports, and distill data for traders to leverage. Similar to other branches of machine learning, NLP adjusts autonomously based on new information. Hence, the quality of data sources greatly influences the effectiveness of machine learning’s self-updating mechanisms.
Different Market Data Level Quotes
| Level 1 Market Data | Level 2 Market Data | Level 3 Market Data |
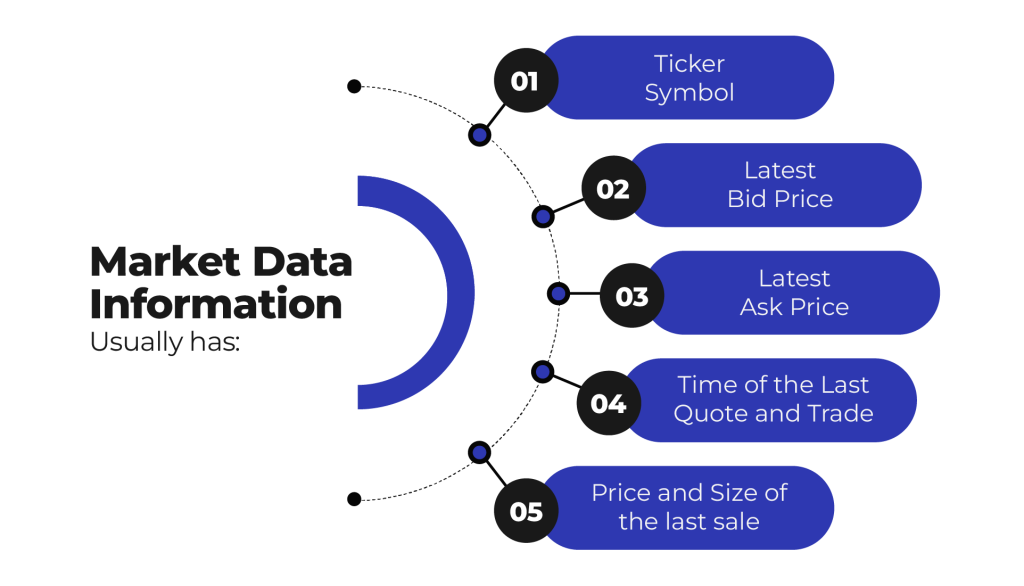
| Level 1 market data refers to the fundamental price details that are commonly known to traders and investors. It encompasses the national best bid and ask prices for a stock, along with the corresponding quantities of shares that traders are attempting to buy or sell at those specific prices. | Level 2 market data incorporates all the elements present in Level 1 data while also providing additional insights into outstanding limit orders situated below the national best bid and above the national best ask. | Level III quotes encompass pricing data regarding security furnished by a trading service. They consist of real-time bid and ask prices, quote size, last trade price, last trade size, and high and low prices for the day. Reserved for registered Nasdaq market makers, Level III allows institutions to input quotes, execute orders, and transmit information, providing a comprehensive view of market depth. |
What Are The Different Types of Charts Using Market Data?
Line Chart
The line chart is a commonly recognized visual representation, typically portraying stock price or trading volume on the vertical or y-axis and the relevant time period on the horizontal or x-axis. Trading volumes reflect the total number of company stocks bought and sold within a specific market day, while the closing stock price is frequently utilized in constructing the line chart.
After appropriately labeling the axes, creating a line chart involves a two-step process. Initially, you select a specific date and plot the closing stock price for that date on the graph. This entails placing a dot on the chart aligned with the respective date and above the corresponding stock price.
Bar Chart
A bar chart, unlike a line chart, offers comprehensive information about a stock’s performance. Each marking on the chart is represented as a vertical line with protruding horizontal lines on either side. The top end indicates the day’s highest trading price, while the bottom denotes the lowest price. The left horizontal line signifies the opening price, and the right denotes the closing price. Hence, each mark on a bar chart provides insights into four critical aspects. Bar charts display prices and reflect price volatility. Intraday charts depict the day’s trading activity. Longer lines on the chart indicate greater disparities between opening and closing prices, implying heightened volatility. Understanding volatility is crucial since increased volatility corresponds to heightened risk levels.
Candlestick Chart
Candlestick charts, although similar to bar charts, present information in a more visually appealing manner. Comprising rectangular blocks with lines on both ends, the upper line represents the day’s highest trading price, while the lower line represents the day’s lowest trading price. Intraday charts illustrate the day’s trading activities. The rectangular block (the body) within the lines represents the day’s opening and closing prices, with the higher price positioned at the top and the lower price at the bottom of the body.
What Are The Benefits of Using Market Data in The Pre-trade Process?
Gain Real-time Insights Into The Capital Market
By utilizing streaming data feeds, traders can integrate historical data with the immediate movements of financial markets to anticipate trends and chart their subsequent actions. Direct access to reliable insights enables both day traders and long-term investors to refine their portfolio strategies based on their chosen stock performance criteria.
Facilitate Algorithmic Trading
At its core, algorithmic trading is a feature present in any reputable stock trading platform. For instance, when a retail investor sets an automatic “buy when the price falls below $60 per share” on their smartphone app, that represents algorithmic trading in practice. This process follows a simple if-then conditional logic.
However, the complexity escalates rapidly. Specialized investment platforms permit more intricate commands, such as “sell when the 50-day moving average dips below the 200-day moving average” and beyond, catering to more sophisticated strategies. In this insightful blog post, Jon delves into the pivotal role of market data in pre-trade analysis. With a keen focus on demystifying its workings, he elucidates the myriad benefits that this data brings to the table.
Leveraging algorithmic trades enables the automatic rebalancing of investment portfolios. For example, if the application detects an imbalanced portfolio with an 80/20 stock-to-bond allocation, it can sell stocks to acquire more bonds as soon as the stock value hits the 80 percent threshold.
Enhance Customer Strategy
Beyond direct trading, market data aids in gaining deeper insights into the customer base of financial institutions. For instance, asset management firms utilize predictive market data to assess the projected growth of each customer’s investment portfolio based on their anticipated contributions over time. By comprehensively understanding the customers’ goals and spending habits, companies can create customer profiles and segment them into groups to estimate their likely investment trends within the organization.
Detect Fraudulent Behavior
Market data isn’t only for investors and advisors but also for regulators. Using market data, regulators can set up algorithms to monitor the risk score of capital market transactions, automatically flagging any anomalies that deviate from the expected range. This process helps in identifying potential fraudulent activities or market manipulation.
Security-oriented market data can identify a company’s key risk indicators, alert whenever there’s a high probability of misconduct, and establish a rapid mitigation plan to prevent potential losses or liability.
Wrapping Up
In conclusion, market data plays a pivotal role in the modern financial landscape, especially in pre-trade analysis. It enables traders, investors, and institutions to make informed decisions, mitigate risks, and ensure regulatory compliance. By leveraging real-time insights, algorithmic trading, customer-centric strategies, and fraud detection mechanisms, market data facilitates effective decision-making and enhances overall market transparency and integrity. As technology continues to evolve, the utilization of market data in the pre-trade process will remain instrumental in driving success and sustainable growth in the ever-changing capital markets. At Ionixx, We understand the importance of market data and how it helps to analyze the trading. To make the pre-trade process more easy and more effective, our team came up with a prominent trade OMS. Contact Us to discuss the product in more detail.